What is MeshView?
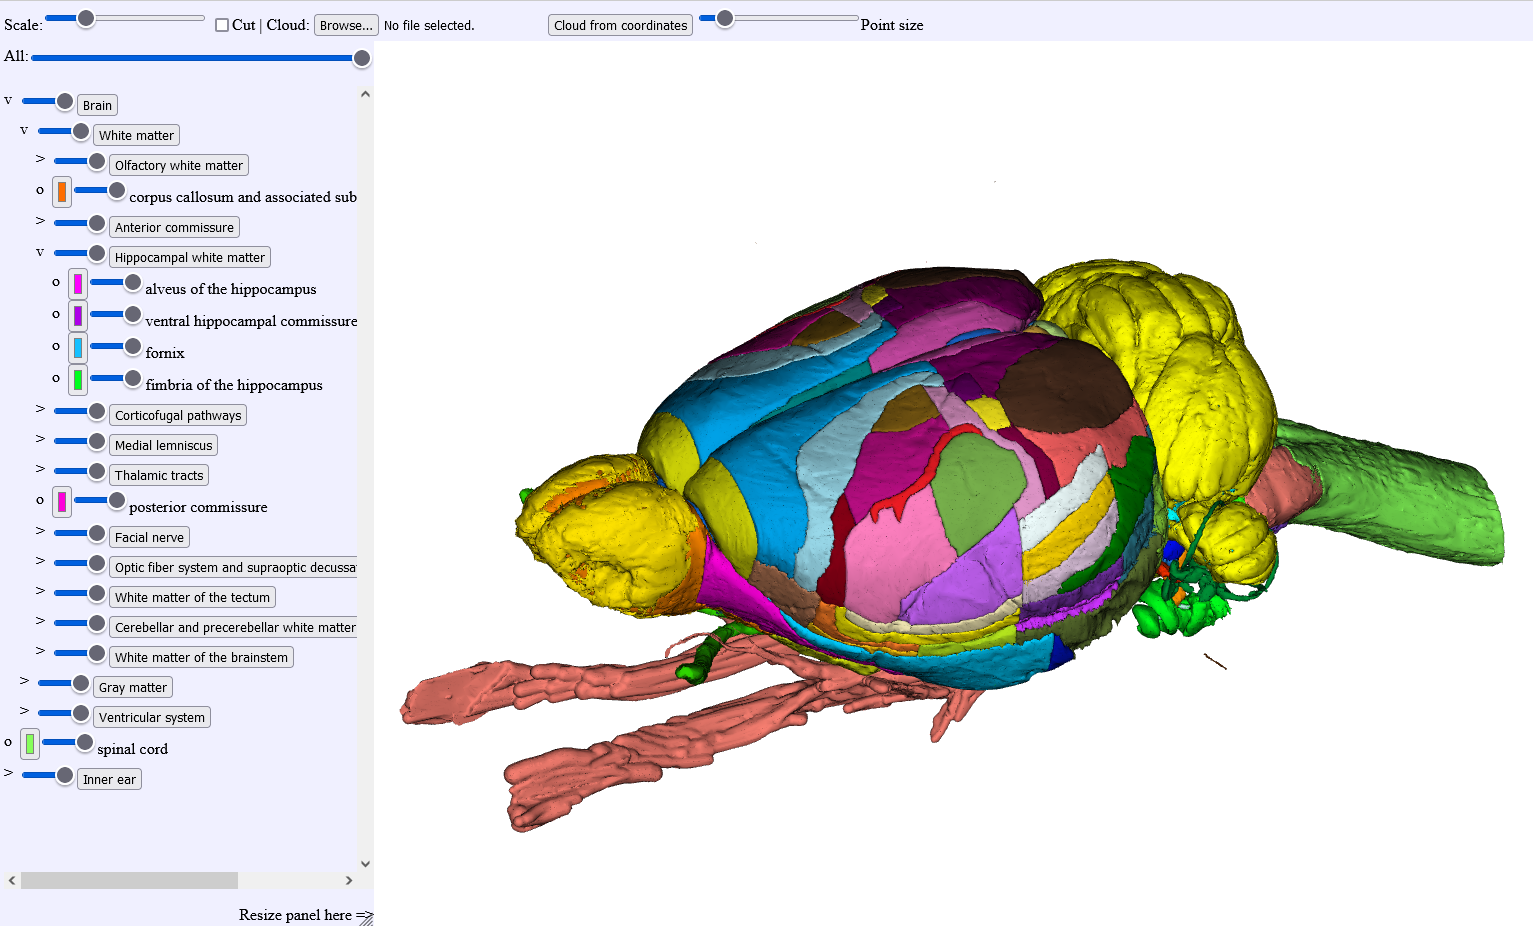
MeshView is one of several tools developed by by the NeSys laboratory at University of Oslo with the aim of facilitating brain atlas-based analysis and integration of experimental data and knowledge about the human and rodent brain. MeshView is a web application for real-time 3D display of surface mesh data representing structural parcellations from volumetric atlases, such as the Waxholm Space Atlas of the Sprague Dawley Rat Brain.
- Key features:
orbiting view with toggleable opaque/transparent/hidden parcellation meshes
rendering user defined cut surface as if meshes were solid objects
rendering point-clouds (simple type-in, or loaded from a JSON format which is typically obtained from the Nutil tool in the QUINT workflow)
coordinate system is compatible with QuickNII (https://quicknii.readthedocs.io)
Tip
MeshView can be used to visualize output from the QUINT workflow
Visit EBRAINS for more information about QUINT. Find full user documentation here.
Which atlases are supported?
Allen Mouse Brain Atlas Common Coordinate Framework version 3 (2015 and 2017) (CCFv3) (Wang et al. 2020. Cell, https://doi.org/10.1016/j.cell.2020.04.007. Epub 2020 May 7; RRID:JCR_020999 and RRID:JRC_021000)
Waxholm Atlas of the Sprague Dawley rat, version 2, 3 and 4 (WHS rat brain atlas) (Kjonigsen LJ, et al. (2015) NeuroImage 108, 441-449. DOI: 10.1016/j.neuroimage.2014.12.080j; Osen et al. 2019. NeuroImage, https:doi.org/10.1016/j.neuroimage.2019.05.016; Kleven et al. Nat Methods, 2020. https://doi.org/10.1038/s41592-023-02034-3; RRID:SCR_017124)
What is the output of MeshView?
Visualisation of a point cloud file file (JSON format) containing the coordinates of objects segmented out from section images in atlas space and atlas meshes. By using the “screenshot” button, users can obtain a png image file of the main window field of view.
The configuration of the current view using the “configuration” button can be exported and reused